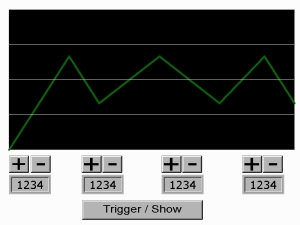
Some people use to doubts what Graph utility is better for his application, in this case I would like to explain the differences between Trend Graph and Historical Trend Graph.
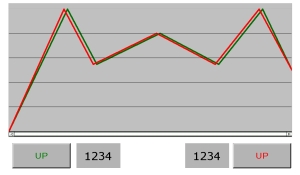
The historical Trend graph is the typical tool to see graphically the evolution in time of some variable, for example, temperature or pressure.
The Trend graph is the tool to show graphically several values in the same graph without the time basis. This graph could be useful, for example, to show the evolution of the different temperatures in a different oven’s chain.
To make easy the implementation of these tools, please check the next examples:
Trend Graph
Historical Trend Graph
To download the files click the left button and select “save target as…”
March 11, 2020 at 3:17 pm
Good morning.
Does anyone have the username and password?
regards
September 13, 2018 at 3:15 am
dear sir, i am already login with this site but i am fail to download this link please help me as soon as possible.
December 14, 2016 at 12:01 am
LOGIN AND PASS HERE! https://delta-ia-tips.com/plc-manual/ (search for “Basic Tips&Tricks”)
April 27, 2016 at 6:05 am
I did the procedure as instructed but its not getting downloaded, can anybody help me with the username and password.. Thanks in advanced
March 29, 2016 at 12:00 pm
Need username and password!
January 28, 2016 at 5:34 pm
Hello, I’m Julio Vera of Fabelec, DELTA We are distributors in Chile, I want to download attachments and I can not, I need a username and password to it.
January 26, 2015 at 10:18 am
Don’t have access to that blog page
April 23, 2014 at 5:00 pm
please fix the links, I need that help
December 20, 2013 at 7:25 pm
I can’t download the files….
please check the link…..